The effect of optical scanners on reducing turnout in Wisconsin
- The Optech Eagle optical scanner was recently decertified by Wisconsin Election authorities
- Voter turnout in Racine county where this optical scanner was used that were not hand recounted was unusually low
- In Racine, could this optical scanner have been reducing turnout from Democrats more than Republicans?
- Similarly, in Milwaukee, where the ES&S D200 was used, votes were not hand recounted, and turnout was unusually low, could the optical scanner equipment used explain the drop?
- By comparing with similar counties with the same negative turnout trends that were recounted by hand, drops in voter turnout with optical scanners was not observed to be due to manipulation or hacking
- Voter turnout dropped more in counties where optical scanner counts were verified and well as in counties where they were not verified.
Introduction
A few weeks ago, Wisconsin state election commissioners voted unanimously voted to end the use of the Optech Eagle optical scanner. This was due to reports during the recount and shortly afterwards that this machine appeared to be more unreliable than others.
The above suggests that at least some optical scanners used in Wisconsin were faulty, but what is not clear is whether these faults could have been favouring one side over another.
This would not be the case in counties recounted by hand; 51 or Wisconsin's 72 counties were fully recounted in this way. However, this leaves 21 that were not. There is still the possibility that faulty, or 'hacked' optical scanners in non-hand recounted counties could have given hundreds or thousands of votes to Trump.
In the following analysis, the effect of the use of optical scanners on the Presidential election in 2016 are compared against a number of county-level demographic variables, many provided by a very useful post about the 2016 election by Thomas Cooley, Ben Griffy, and Peter Rupert at Economic Snapshot, and some from David Greenwald (@davidegreenwald) and colleagues, who have also been looking into the 2016 Wisconsin presidential election. optical scanner presence and make data at the municipality level was taken from Verified Voting. The spatial data used for the maps was taken from the 'GeoData@Wisconsin' site, hosted by the University of Wisconsin - Madison. Finally, the vote and registered voter data was taken from the Wisconsin Elections Commission
One final note - to remove potentially influential outliers I removed reporting units with less than 20 votes cast, with a turnout lower than 25%, and where the vote % for Republicans reduced by 40% or more compared to 2012.
Proportion of votes from optical scanners in Wisconsin
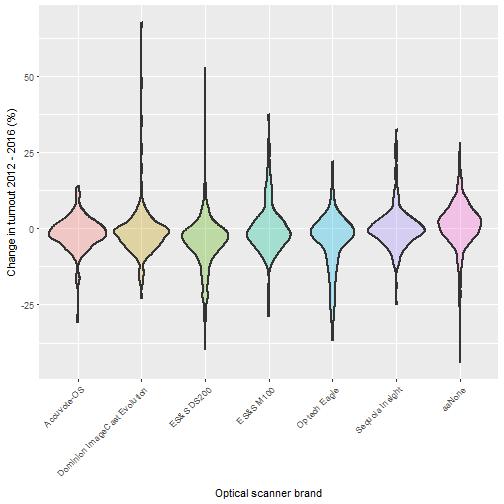
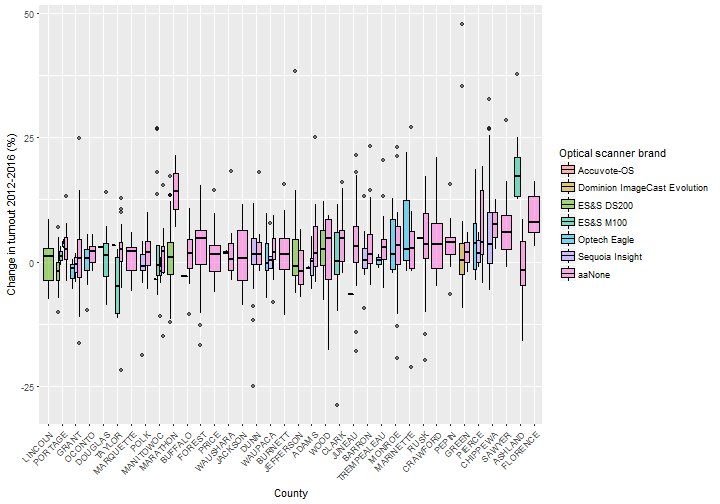
The following graph and tables summarises the difference in turnout change (2012-2016) according to the optical scanner brands used in Wisconsin, and the approximate number of wards in which optical scanners are used (based on wards successfully matched between 2012 and 2016). It can clearly be seen that the Optech Eagle, and the ES&S D200 were used in areas that had the biggest drop in voter turnout compared to 2012.
| Optical scanner brand | Number of wards |
|---|---|
| Accuvote-OS | 128 |
| Dominion ImageCast Evolution | 232 |
| ES&S DS200 | 1259 |
| ES&S M100 | 167 |
| Optech Eagle | 245 |
| Sequoia Insight | 193 |
| aaNone | 860 |
| Optical scanner brand | Change in turnout 2012-2016 (%) |
|---|---|
| Accuvote-OS | -1.5 |
| Dominion ImageCast Evolution | -1.4 |
| ES&S DS200 | -4.4 |
| ES&S M100 | 0.1 |
| Optech Eagle | -4.3 |
| Sequoia Insight | 0.4 |
| aaNone | 1.3 |
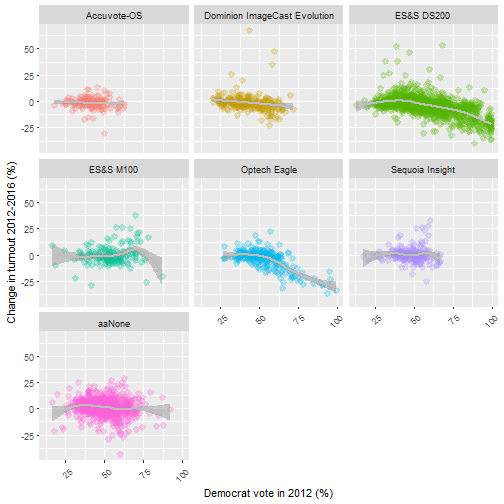
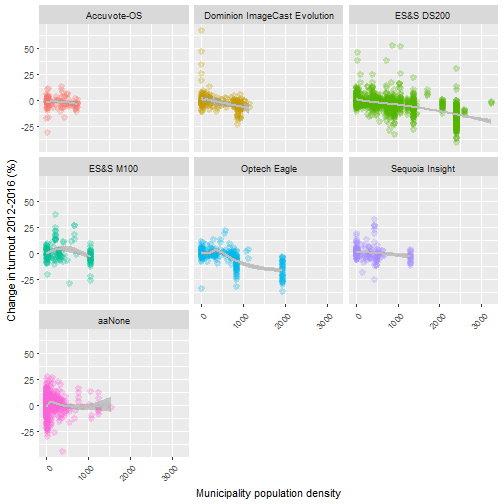
The following graphs compare the change in turnout 2012-2016 between optical scanner brands as well as the vote for Barack Obama in 2012 and the population density in the municipality. Both the Optech Eagle and the ES&S D200 are used in areas where the greatest drop in turnout correlates with the greatest vote for Democrats in 2012. Could this indicate that the machines were manipulated to be faulty in areas with the greatest Democrat vote??
Comparing voter turnout and optical scanner brand by county
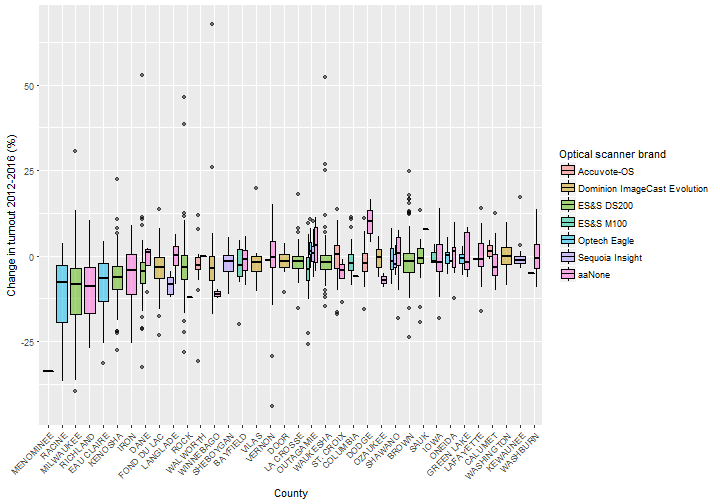
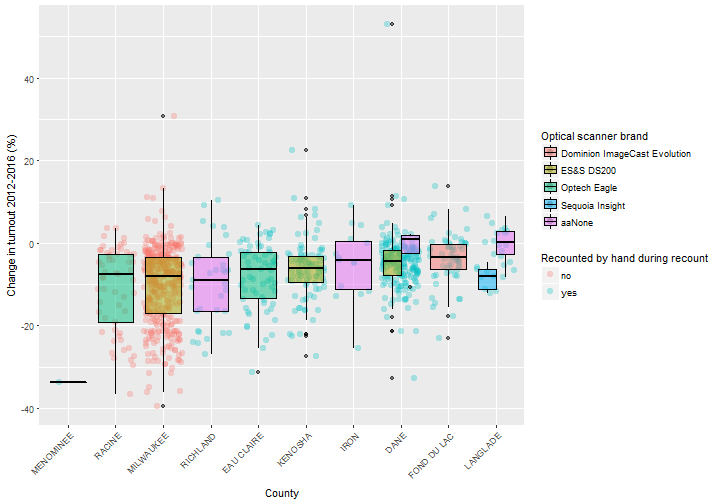
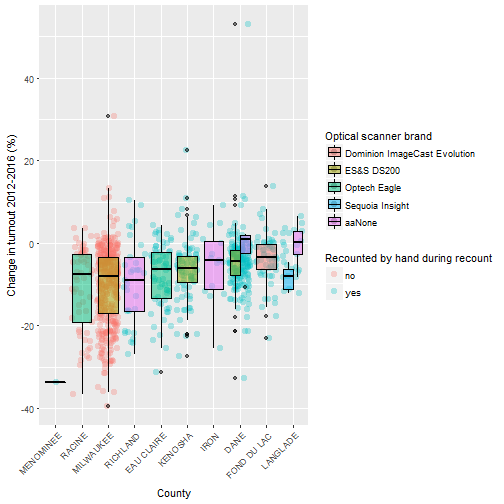
The below graphs rank the Wisconsin counties according to the change in turnout 2012-2016, along with the brand of optical scanner used. The counties with the greatest decrease in turnout were Menominee (albeit with too few wards to statistically analyse, and so will not be taken into consideration further on). The colours of the points also indicate if the county was recounted by hand during the December 2016 recount.
It can be seen that two of the counties that had the greatest drop in turnout between 2012 and 2016 - Racine and Milwaukee - did not have a hand recount in December 2016.
Statistically comparing the optical scanner brands and counties
Now that we have done some initial data exploration to compare the optical scanner brands and their use in the Wisconsin counties, we can bring in some statistical models to see if there are any real differences worth worrying about. Most of the models in the following section are robust linear regressions, with errors clustered around county.
The first model below shows the influence of the optical scanner model on the voter turnout change 2012-2016, and whether this is different in areas that voted more for Barack Obama in 2012. The term os_model_con=Optech Eagle * dem.perc2012 below has a statistically significant effect (p < 0.05, large t value). It also shows that the ES&S D200, used in Milwaukee, is statistically significant in a similar way (os_model_con=ES&S DS200 * dem.perc2012 term), however it has a much weaker effect than the Optech Eagle (lower t value).
Is the effect of the Optech Eagle the same in the 51 counties that were hand recounted as in the 21 counties that were not? The following model shows that hand-recounted counties (rehandcounted_countiesyes) had a greater voter turnout, and that the presence of the Optech Eagle was linked to reduced voter turnout (os_model_optechyes). However, the Optech Eagle did not have a statistically significantly different effect depending on whether they were placed in a hand recounted county or not.
The above finding is contradicted however when we add a number of voting and demographic variables alongside the optical scanning technology and recount variables. In the model below, rehandcounted_counties=yes * os_model_optech=yes is now statistically significant. It is worth looking into the effect of the Optech Eagle further.
Looking at the 21 counties that were not hand-recounted, do any stand out as having a particularly low voter turnout (compared with BROWN county, turnout change just around 0)? The following shows that Racine and Milwaukee counties had an unusally low voter turnout, event amongst counties that were not hand recounted.
Focus on non-hand recounted counties with the lowest turnout - Racine and Milwaukee
The figure below shows that Racine and Milwaukee are two counties that had an unusually low voter turnout compared to others. Racine was not hand-recounted, used the Optech Eagle optical scanner technology, which was known to have faults, and which has been shown to have had more of an influence to reduce turnout in areas with higher 2012 Democrat vote.
How could we prove that Democrat votes were being targeted in Racine county? Well, we have another similar county to compare against that was hand recounted (and therefore with verified results), Eau Claire. This county also used the Optech Eagle optical scanners, and experienced a significant drop in voter turnout compared to 2012.
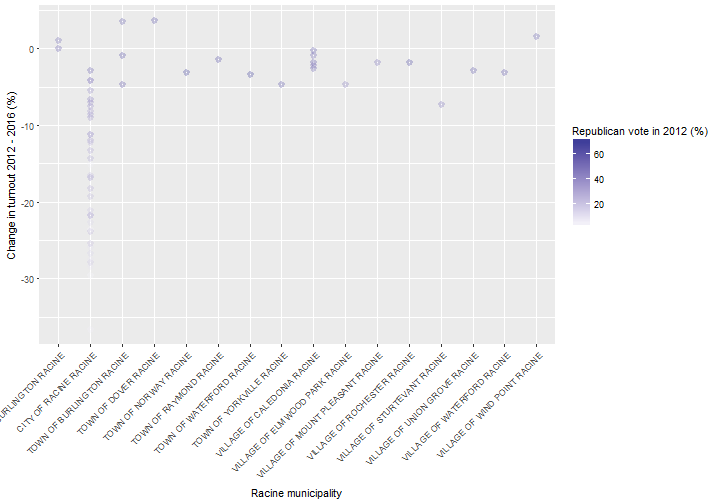
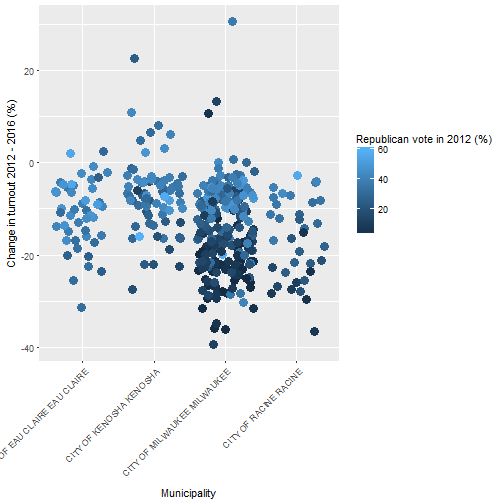
Below we compare the effect of optical scanners in four of the counties with the greatest drop in voter turnout according to municipality (Racine, Eau Claire, Kenosha, and Milkwaukee). They all used the Optech Eagle or the ES&S D200 optical scanner. Two of them (Eau Claire and Kenosha) had the votes verified by a hand recount, while the two others (Racine and Milwaukee) did not.
Clearly we can see that in these counties, the cities experienced the greatest drop in voter turnout between 2012-2016, regardless of whether they were hand recounted or not. We will look more closely at these cities.
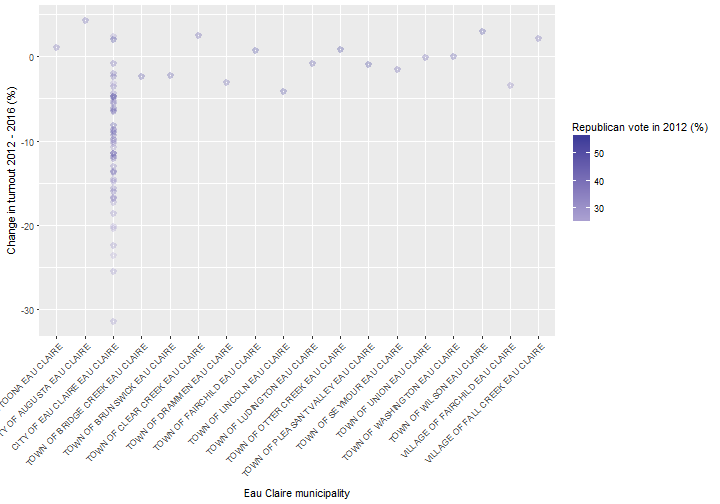
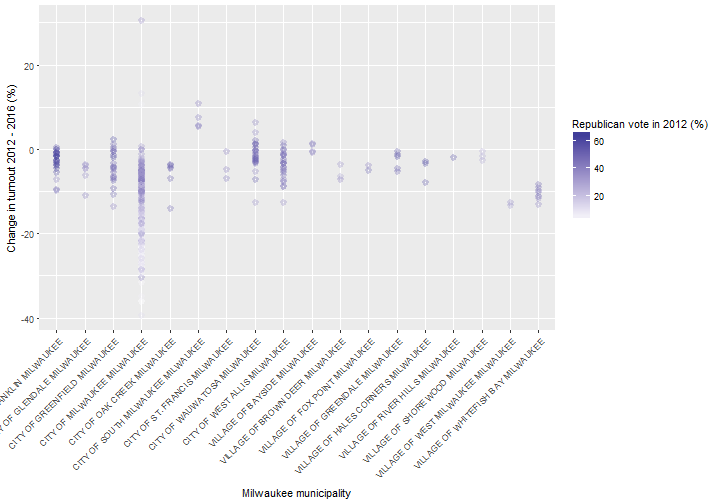
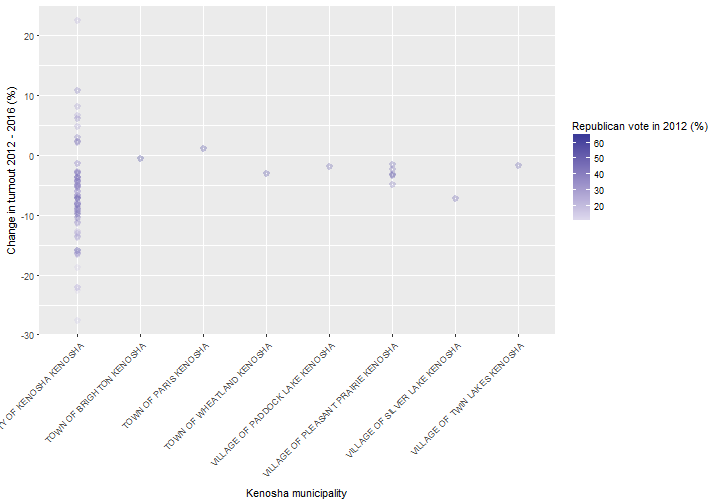
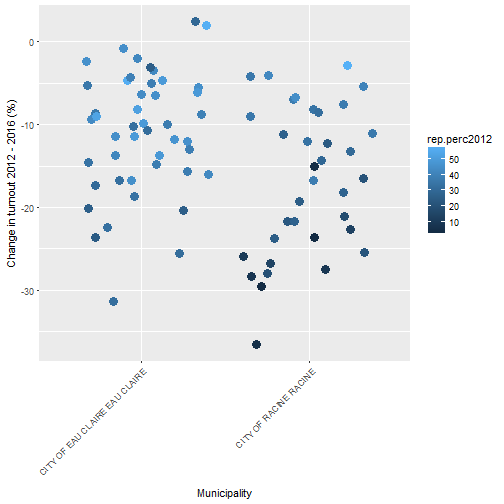
Let's compare the cities statistically. Here is the city of Racine side by side with the city of Eau Claire. If the unverified, Racine results were different from the verified, Eau Claire results in any way, we would expect to see countyRACINE or countyRACINE:dem.perc2012 to be statistically significant below. However, they are not. Only dem.perc2012 is statistically significant, which means that the 2012 Democrat vote could explain the drop in voter turnout in both cities, not differences in the way the technology was used.
Here is a graph showing the difference in turnout between Eau Claire and Racine cities.
I will do a similar analysis for two cities that used the ES&S D200, and where the turnout dropped since 2012. These are Milwaukee city (vote not verified by hand during recount) vs Kenosha city (vote verified by hand during recount).
And here's a graph comparing Milwaukee city with Kenosha City.
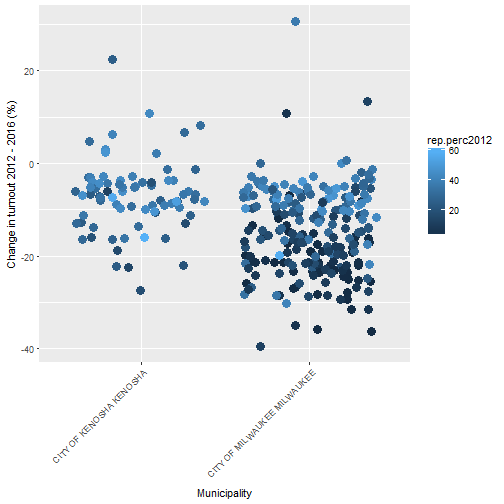
We can see similar results to the above if we compare the bottom four counties. Milwaukee and Racine are unverified, non-hand recounted cities, whereas Kenosha and Eau Claire are counties which had their results verified by a recount. In the below model, the fact of being hand recounted or not (rehandcounted_countiesyes) did not significantly effect the change in voter turnout 2012-2016, which suggests that the reduction in turnout was not manipulated in unverified cities.
Finally, a graph of the four cities we have been comparing, side by side.
Conclusion
We have seen that the use of the Optech Eagle reduced voter turnout in 2016 compared to 2012. However, the effect on turnout was the same in cities where results were verified by a hand recount as those that were not. A similar pattern was found in areas using the ES&S D200 optical scanner brand (e.g. used in Milwaukee).
These results suggests that manipulation of optical scanners in 'unverified' counties very likely did not happen, and that faulty optical scanners across the state affected voter turnout regardless of an area's voting tendency.
Comments !