Wisconsin voting machines and the Democrat vote
- Comparing the same voting municipalities in 2012 and 2016, those using voting machines had a 4.6% greater drop in Democrat vote in 2016 compared to those not using voting machines.
- The presence of voting machines did not affect the Democrat vote in the 2012 presidential election, meaning that the voting machine effect was specific to the 2016 election.
- It was not possible to determine which voting machine make/model was linked to the biggest drops in the vote for Democrats.
- It is important to note that these results does not necessarily mean the voting machines were manipulated; further investigation is necessary to determine the cause of this effect.
P.S. An interactive carto map of the Republican vote in 2016 accompanies this post. Go play with the data! And yes I realise it's weird to have a Republican vote map accompanying a Democrat vote discussion, but my internet connection is too bad where I am at the moment to change my Carto map, so here you are until I can. Also, the code underlying the analysis described here can be found at Github. The .csv files used in the models are named modeldfward.o.csv (original data) and modeldfward.r.csv (recount data).
Did voting machines affect the 2016 Presidential elections in Wisconsin?
A previous analysis of votes on a county level suggested that the Wisconsin 2016 vote may have been affected by the presence of voting machines (also known as touchscreen voting systems, or direct recording electronic voting machines) and optical scanners. However, at the time I had only the summarised votes of the 72 Wisconsin counties, so it was impossible to say for sure. However, in December, data of the municipality-level votes for Wisconsin became publicly available (1900 municipalities in total), as well as the voting data for the recount conducted in early December. Now we can attempt to address two important questions.
Did the presence of voting machines affect the Democrat or Republican votes in the 2016 elections?
Did the recount change the effects of the voting machines or optical scanners suggested the first time around?
In the following analysis, the effect of the presence of voting machines / optical scanners on the Democrat presidential votes in 2016 and 2016 are compared against a number of county-level demographic variables, many provided by a very useful post about the 2016 election by Thomas Cooley, Ben Griffy, and Peter Rupert at Economic Snapshot, and some from David Greenwald (@davidegreenwald) and colleagues, who have also been looking into the 2016 Wisconsin presidential election.
A note of caution: the outputs described here suggest that the presence of voting machines / optical scanners could be a PREDICTOR of an increased or decreased vote for Democrat as determined by the statistical model. We cannot know from this alone if the voting machines / optical scanners were manipulated in any way, it only suggests that further investigation is necessary to determine the cause of this effect.
2016 original Democrat vote - effect of voting machines and optical scanners
Voting machines
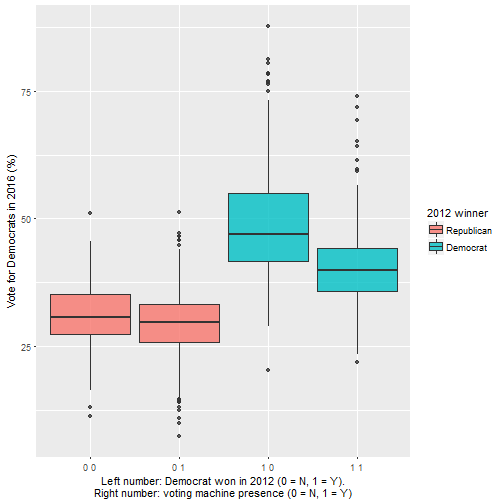
Voting machines decreased votes for democrats (a average reduction of ~4.6%); however this difference could be due to random variation (p > 0.05 for the stats nerds). But when considering municipalities won by the Democrats in 2012 (Obama) against those won by the Republicans (Romney), there was a statistically significant effect (i.e. extremely unlikely to be due to simple 'randomness' in votes). In 2012 Democrat-won municipalities the average vote was 48.7% for Hillary Clinton when voting machines were present compared to 40.9% when voting machines were not present, a difference of 7.8%. There was not a significant effect of voting machines in areas won by the Republicans in 2012; 31.1% voted for Hillary Clinton in areas without voting machines compared to 29.6% of voters in areas with voting machines. Click the button below to see the data and relevant graphs.
Hide graph and data
| Municipality won by Democrats in 2012 |
Use voting machines |
Vote for Democrats in 2016 (%) |
| 0 |
0 |
31.0 |
| 0 |
1 |
29.6 |
| 1 |
0 |
48.7 |
| 1 |
1 |
40.6 |
| Use voting machines |
Vote for Democrats in 2016 (%) |
| 0 |
-8.7 |
| 1 |
-13.4 |
Optical scanners
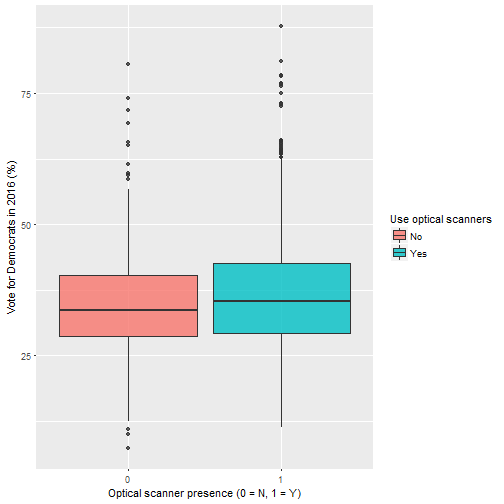
The presence of optical scanners did not significantly affect the Democrat vote; the slight observed increase could be attributed to random variation.
Show graph and data
## Loading required package: magrittr
##
## Attaching package: 'magrittr'
## The following object is masked from 'package:tidyr':
##
##     extract
| Use optical scanners |
Vote for Democrats in 2016 (%) |
| 0 |
34.8 |
| 1 |
36.9 |
Model summary - 2016 Democrat votes
Below is the model output for the 2016 votes for Democrat, reflecting the outputs above. I won't try to explain the technical details of the model here, but I will leave it for statisticians to critique. P.S. I found the method to toggle code sections here: here
Show model code
## Linear mixed-effects model fit by REML
##  Data: model.o.df
##        AIC      BIC    logLik
##   11643.55 11759.33 -5800.775
##
## Random effects:
##  Formula: ~log(votes.tot2016) + demwinner2012 | county
##  Structure: General positive-definite, Log-Cholesky parametrization
##                    StdDev    Corr
## (Intercept)        5.9418042 (Intr) l(.201
## log(votes.tot2016) 0.7710069 -0.773
## demwinner20121     2.4130244  0.848 -0.898
## Residual           5.1877929
##
## Fixed effects: list(fin.formula)
##                            Value Std.Error   DF    t-value p-value
## (Intercept)             61.55172  4.983697 1762  12.350614  0.0000
## tch.use1                -0.37745  0.914927 1762  -0.412552  0.6800
## demwinner20121          10.46442  0.713769 1762  14.660799  0.0000
## log(votes.tot2016)       1.88691  0.186136 1762  10.137303  0.0000
## os.use1                 -0.13546  0.467553 1762  -0.289724  0.7721
## inc_2015                 0.00010  0.000024 1762   4.154071  0.0000
## unemp_rate               0.01644  0.052542 1762   0.312861  0.7544
## pct_male                -0.29568  0.039473 1762  -7.490768  0.0000
## age_med                  0.10703  0.023274 1762   4.598990  0.0000
## pct_white               -0.30303  0.023041 1762 -13.151897  0.0000
## pct_latino              -0.02795  0.032225 1762  -0.867242  0.3859
## pct_black                0.12445  0.070783 1762   1.758265  0.0789
## pct_hs                  -0.13353  0.095637   70  -1.396228  0.1671
## tch.use1:demwinner20121 -2.32748  0.815586 1762  -2.853753  0.0044
##  Correlation:
##                         (Intr) tch.s1 d20121 l(.201 os.us1 i_2015 unmp_r
## tch.use1                 0.117
## demwinner20121          -0.022  0.238
## log(votes.tot2016)      -0.328 -0.030 -0.292
## os.use1                 -0.107  0.156  0.093 -0.299
## inc_2015                -0.086  0.033  0.044 -0.122 -0.043
## unemp_rate              -0.107 -0.023 -0.053  0.000  0.009  0.215
## pct_male                -0.433  0.014  0.078  0.134  0.086 -0.064  0.026
## age_med                 -0.085 -0.013 -0.010  0.136  0.026 -0.455 -0.127
## pct_white               -0.446 -0.020  0.068  0.048 -0.004 -0.006  0.098
## pct_latino              -0.178  0.021  0.001  0.027 -0.036  0.085 -0.038
## pct_black               -0.086 -0.040 -0.027 -0.119 -0.013  0.122  0.011
## pct_hs                  -0.708 -0.326 -0.021  0.040  0.103  0.125  0.012
## tch.use1:demwinner20121 -0.004 -0.292 -0.782  0.122 -0.119 -0.006  0.036
##                         pct_ml age_md pct_wh pct_lt pct_bl pct_hs
## tch.use1
## demwinner20121
## log(votes.tot2016)
## os.use1
## inc_2015
## unemp_rate
## pct_male
## age_med                  0.006
## pct_white               -0.008 -0.124
## pct_latino               0.004  0.125  0.243
## pct_black               -0.216 -0.034  0.369 -0.006
## pct_hs                  -0.002 -0.057  0.017  0.013  0.037
## tch.use1:demwinner20121 -0.023  0.030 -0.010  0.009  0.008  0.039
##
## Standardized Within-Group Residuals:
##         Min          Q1         Med          Q3         Max
## -3.82943018 -0.61414715 -0.01616616  0.60129549  4.58598011
##
## Number of Observations: 1846
## Number of Groups: 72
Change in Democrat votes from 2012 to 2016
Effect of voting machines
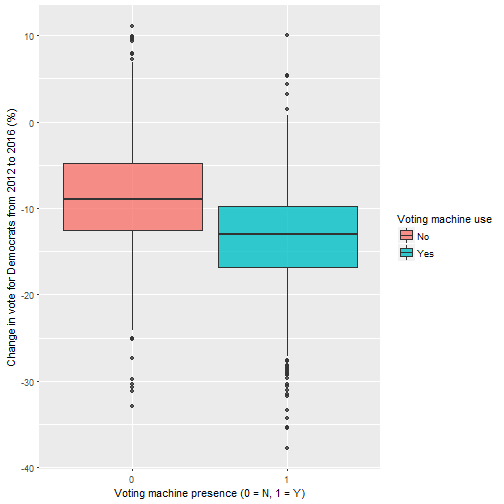
Municipalities without touchscreen voting machines voted on average 8.7% less for Democrat candidates in 2016 compared to 2012; however, in areas with voting machines this was 13.3% (4.6% difference). Therefore, the presence of voting machines resulted in a 4.6% additional drop in Democrat vote between 2012 and 2016. This means that voting machines behaved differently in 2016 compared to 2012; they had a greater negative effect in 2016.
The change was similar whether the municipality was won by Democrats or Republicans in 2012. Vote % decreased in Republican-won municipalities by -7.6 in non-voting machine areas compared to -11.7 (4.1% difference) in voting machine areas, and in Democrat-won municipalities from -10.0 in non-voting machine areas to -15.8% (5.8%) in voting machine areas.
Hide graph and data
| Use voting machines |
Change in vote for Democrats from 2012 to 2016 (%) |
| 0 |
-8.7 |
| 1 |
-13.4 |
| Municipality won by Democrats in 2012 |
Use voting machines |
Change in vote for Democrats from 2012 to 2016 (%) |
| 0 |
0 |
-7.5 |
| 0 |
1 |
-11.7 |
| 1 |
0 |
-10.0 |
| 1 |
1 |
-16.0 |
Since the presence of optical scanners had no effect on the change in Democrat vote between 2012 and 2016, I have not discussed it further here.
Model output
Show model code
## dem.change.perc ~ log(votes.tot2016) + os.use + inc_2015 + unemp_rate +
##     pct_male + age_med + pct_white + pct_latino + pct_black +
##     pct_hs + tch.use + demwinner2012
## Linear mixed-effects model fit by REML
##  Data: model.o.df
##        AIC      BIC    logLik
##   10545.46 10655.74 -5252.732
##
## Random effects:
##  Formula: ~1 + log(votes.tot2016) + demwinner2012 | county
##  Structure: General positive-definite, Log-Cholesky parametrization
##                    StdDev    Corr
## (Intercept)        4.1330858 (Intr) l(.201
## log(votes.tot2016) 0.5887792 -0.942
## demwinner20121     1.6928688  0.186 -0.340
## Residual           3.9335394
##
## Fixed effects: list(dem.formula)
##                        Value Std.Error   DF   t-value p-value
## (Intercept)        -7.822513 3.0244992 1763 -2.586383  0.0098
## log(votes.tot2016)  1.494135 0.1399855 1763 10.673499  0.0000
## os.use1             0.034387 0.3300737 1763  0.104179  0.9170
## inc_2015            0.000248 0.0000179 1763 13.853341  0.0000
## unemp_rate         -0.178779 0.0396106 1763 -4.513402  0.0000
## pct_male           -0.071882 0.0298708 1763 -2.406432  0.0162
## age_med             0.040408 0.0171512 1763  2.355960  0.0186
## pct_white          -0.071069 0.0168975 1763 -4.205914  0.0000
## pct_latino          0.013726 0.0241942 1763  0.567329  0.5706
## pct_black          -0.097043 0.0535673 1763 -1.811601  0.0702
## pct_hs             -0.239268 0.0403881   70 -5.924226  0.0000
## tch.use1           -0.781848 0.4294067 1763 -1.820763  0.0688
## demwinner20121     -2.963730 0.3150081 1763 -9.408424  0.0000
##  Correlation:
##                    (Intr) l(.201 os.us1 i_2015 unmp_r pct_ml age_md pct_wh
## log(votes.tot2016) -0.423
## os.use1            -0.088 -0.317
## inc_2015           -0.093 -0.135 -0.054
## unemp_rate         -0.138 -0.008  0.019  0.222
## pct_male           -0.538  0.139  0.074 -0.055  0.032
## age_med            -0.118  0.142  0.059 -0.450 -0.143  0.007
## pct_white          -0.527  0.050 -0.023 -0.025  0.111 -0.012 -0.103
## pct_latino         -0.214  0.017 -0.045  0.069 -0.044  0.009  0.136  0.241
## pct_black          -0.079 -0.127 -0.020  0.094  0.010 -0.218 -0.022  0.359
## pct_hs             -0.503  0.071  0.135  0.210  0.015 -0.010 -0.108 -0.002
## tch.use1            0.041  0.015  0.208  0.052  0.003  0.021  0.012 -0.017
## demwinner20121     -0.131 -0.112  0.047  0.079 -0.032  0.099  0.021  0.096
##                    pct_lt pct_bl pct_hs tch.s1
## log(votes.tot2016)
## os.use1
## inc_2015
## unemp_rate
## pct_male
## age_med
## pct_white
## pct_latino
## pct_black          -0.017
## pct_hs              0.027  0.042
## tch.use1            0.022 -0.040 -0.328
## demwinner20121      0.009 -0.040  0.008  0.047
##
## Standardized Within-Group Residuals:
##        Min         Q1        Med         Q3        Max
## -3.8771518 -0.5672485 -0.0124410  0.5615406  6.8900976
##
## Number of Observations: 1846
## Number of Groups: 72
Did the effect differ in terms of voting machine makes/models?
NOTE: The following analysis was conducted only on municipalities that used voting machines
In Wisconsin, voting machine makes are used. The most common is the Sequoia/Dominion 'Edge', which is used in 45 counties. The second most common is the Premier/Diebold/Dominion 'Accuvote TSX', which is used in 13 counties. Finally, the ES&S 'Ivotronic' is in use in two counties. There are large differences in Democrat vote between the counties considered, so it is not reasonable to compare % Democrat vote in 2016 between counties and systems. Instead, here I look at the difference in Democrat vote in the same municipalities with these voting machines in 2012 and 2016.
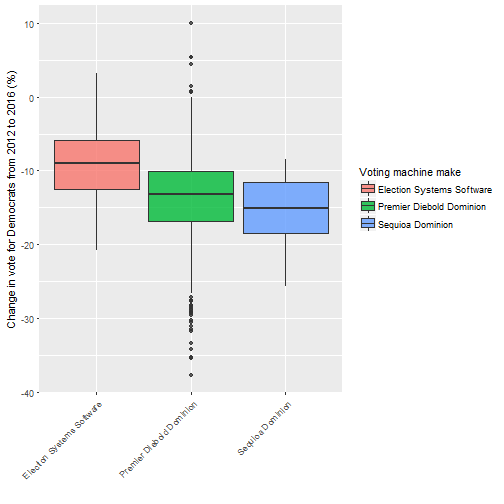
The below table and graph shows that the Premier Diebold Dominion Accuvote TSX reduced the Democrat vote by the least in 2016 compared to 2012 (-8.9%) compared to -13.7% and -15.5% for the other two voting machines. However, this difference was not statistically significant, and so could be attributed to random variation.
Hide graph and data
| Voting machine make |
Change in vote for Democrats from 2012 to 2016 (%) |
| Election Systems Software |
-9.1 |
| Premier Diebold Dominion |
-13.6 |
| Sequioa Dominion |
-15.5 |
The model code underlying these findings are below:
Show model output
## dem.change.perc ~ log(votes.tot2016) + os.use + inc_2015 + unemp_rate +
##     pct_male + age_med + pct_white + pct_latino + pct_black +
##     pct_hs + tch_make + demwinner2012
## Linear mixed-effects model fit by REML
##  Data: tch.model.o.df
##        AIC      BIC    logLik
##   6781.823 6872.631 -3372.911
##
## Random effects:
##  Formula: ~log(votes.tot2016) | county
##  Structure: General positive-definite, Log-Cholesky parametrization
##                    StdDev    Corr
## (Intercept)        4.6536295 (Intr)
## log(votes.tot2016) 0.7172024 -0.964
## Residual           4.2158415
##
## Fixed effects: list(tch.formula)
##                                                      Value Std.Error   DF
## (Intercept)                                     -14.462110  4.101374 1103
## log(votes.tot2016)                                1.521402  0.209856 1103
## os.use1                                           0.130327  0.417326 1103
## inc_2015                                          0.000223  0.000033 1103
## unemp_rate                                       -0.147400  0.048949 1103
## pct_male                                         -0.005705  0.037591 1103
## age_med                                           0.043827  0.022825 1103
## pct_white                                        -0.059053  0.022863 1103
## pct_latino                                        0.009057  0.030940 1103
## pct_black                                        -0.193466  0.076077 1103
## pct_hs                                           -0.174928  0.056360   44
## tch_makeDominion (Sequoia)/Command Central-Edge  -0.965208  0.923699 1103
## tch_makeES&S iVotronic                           -1.085774  1.465642   44
## demwinner20121                                   -3.182645  0.302287 1103
##                                                    t-value p-value
## (Intercept)                                      -3.526162  0.0004
## log(votes.tot2016)                                7.249744  0.0000
## os.use1                                           0.312291  0.7549
## inc_2015                                          6.766362  0.0000
## unemp_rate                                       -3.011333  0.0027
## pct_male                                         -0.151766  0.8794
## age_med                                           1.920127  0.0551
## pct_white                                        -2.582935  0.0099
## pct_latino                                        0.292745  0.7698
## pct_black                                        -2.543019  0.0111
## pct_hs                                           -3.103745  0.0033
## tch_makeDominion (Sequoia)/Command Central-Edge  -1.044938  0.2963
## tch_makeES&S iVotronic                           -0.740818  0.4627
## demwinner20121                                  -10.528555  0.0000
##  Correlation:
##                                                 (Intr) l(.201 os.us1
## log(votes.tot2016)                              -0.364
## os.use1                                         -0.092 -0.360
## inc_2015                                        -0.040 -0.204 -0.061
## unemp_rate                                      -0.111 -0.011 -0.008
## pct_male                                        -0.509  0.108  0.094
## age_med                                         -0.097  0.175  0.059
## pct_white                                       -0.534  0.036 -0.030
## pct_latino                                      -0.254  0.030 -0.056
## pct_black                                       -0.043 -0.099 -0.046
## pct_hs                                          -0.503 -0.009  0.176
## tch_makeDominion (Sequoia)/Command Central-Edge -0.169 -0.006  0.206
## tch_makeES&S iVotronic                          -0.014  0.052  0.068
## demwinner20121                                  -0.182  0.008  0.025
##                                                 i_2015 unmp_r pct_ml
## log(votes.tot2016)
## os.use1
## inc_2015
## unemp_rate                                       0.259
## pct_male                                        -0.108  0.042
## age_med                                         -0.512 -0.189  0.029
## pct_white                                       -0.068  0.056  0.027
## pct_latino                                       0.067 -0.027  0.014
## pct_black                                        0.154 -0.001 -0.299
## pct_hs                                           0.160  0.013 -0.004
## tch_makeDominion (Sequoia)/Command Central-Edge  0.031 -0.013  0.007
## tch_makeES&S iVotronic                           0.008  0.005  0.012
## demwinner20121                                   0.147 -0.004  0.138
##                                                 age_md pct_wh pct_lt
## log(votes.tot2016)
## os.use1
## inc_2015
## unemp_rate
## pct_male
## age_med
## pct_white                                       -0.057
## pct_latino                                       0.124  0.304
## pct_black                                       -0.049  0.338  0.050
## pct_hs                                          -0.139 -0.025  0.000
## tch_makeDominion (Sequoia)/Command Central-Edge -0.030  0.024  0.076
## tch_makeES&S iVotronic                           0.070 -0.009  0.058
## demwinner20121                                   0.031  0.120  0.019
##                                                 pct_bl pct_hs t_D(SC
## log(votes.tot2016)
## os.use1
## inc_2015
## unemp_rate
## pct_male
## age_med
## pct_white
## pct_latino
## pct_black
## pct_hs                                          -0.001
## tch_makeDominion (Sequoia)/Command Central-Edge  0.032 -0.110
## tch_makeES&S iVotronic                           0.017 -0.301  0.608
## demwinner20121                                  -0.060 -0.004 -0.077
##                                                 t_ES&i
## log(votes.tot2016)
## os.use1
## inc_2015
## unemp_rate
## pct_male
## age_med
## pct_white
## pct_latino
## pct_black
## pct_hs
## tch_makeDominion (Sequoia)/Command Central-Edge
## tch_makeES&S iVotronic
## demwinner20121                                   0.008
##
## Standardized Within-Group Residuals:
##          Min           Q1          Med           Q3          Max
## -3.495205614 -0.615428955  0.006992733  0.608007913  6.401372626
##
## Number of Observations: 1161
## Number of Groups: 47
Did voting machines have the same effect in 2012?
NOTE: The following assumes that the same voting equipment was present in the same place in 2012 as in 2016, which may not have been the case everywhere.
Voting machines
We can see from these results that voting machines and optical scanners had very different effects in 2012 and in 2016. voting machines had a very slight negative effect on the Democrat vote (-0.5%) in 2012, which could be attributed to random variation. Similarly, the difference in Democrat vote in voting machine municipalities won by Democrats in 2012 (58.6% reduced to 56.7% with voting machines, a 1.9% difference) was statistically insignificant and small compared to the result we saw in 2016 (a 7.8% drop in Democrat vote with voting machines present).
Hide graph and data
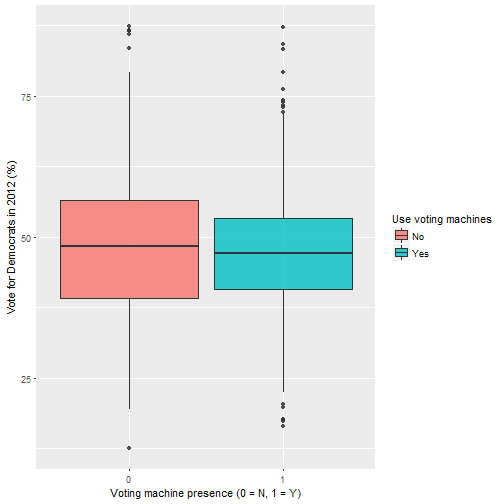
| Use voting machines |
Vote for Democrats in 2012 (%) |
| 0 |
48.1 |
| 1 |
47.3 |
Optical scanners
In 2012, optical scanner presences had a negative effect on Democrat vote (linked to a drop in Democrat vote percentage from 49.5% to 46.2%). In comparison, in 2016 there was no effect of optical scanners (35.0% and 36.9% Democrat vote in counties with and without counties respectively, which was not statistically significant).
Show graph and data
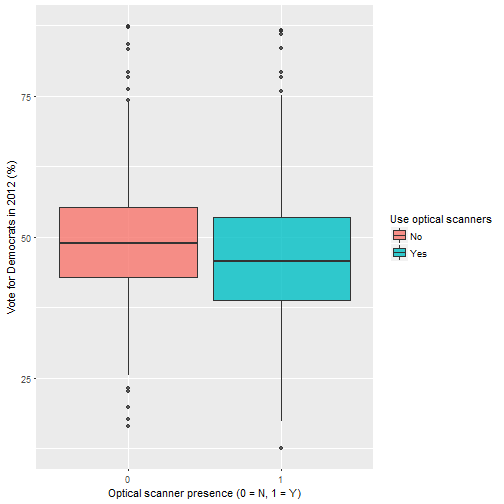
| Use optical scanners |
Vote for Democrats in 2012 (%) |
| 0 |
49.4 |
| 1 |
46.2 |
Model code
Show model output
## dem.perc2012 ~ inc_2015 + unemp_rate + pct_male + age_med + pct_white +
##     pct_latino + pct_black + pct_hs + tch.use + os.use + log(votes.tot2012) +
##     os.use:log(votes.tot2012)
## Linear mixed-effects model fit by REML
##  Data: model.o.df
##        AIC      BIC    logLik
##   12526.73 12609.43 -6248.364
##
## Random effects:
##  Formula: ~1 | county
##         (Intercept) Residual
## StdDev:    7.643413  6.61758
##
## Fixed effects: list(dem2012.formula)
##                                Value Std.Error   DF    t-value p-value
## (Intercept)                100.60718  7.829308 1763  12.850072  0.0000
## inc_2015                    -0.00019  0.000030 1763  -6.456460  0.0000
## unemp_rate                   0.27925  0.066069 1763   4.226654  0.0000
## pct_male                    -0.40989  0.049650 1763  -8.255708  0.0000
## age_med                      0.03840  0.029523 1763   1.300710  0.1935
## pct_white                   -0.33020  0.028597 1763 -11.546677  0.0000
## pct_latino                  -0.03634  0.040611 1763  -0.894873  0.3710
## pct_black                    0.32223  0.089451 1763   3.602364  0.0003
## pct_hs                       0.13912  0.173006   70   0.804108  0.4241
## tch.use1                    -0.76033  1.318675 1763  -0.576584  0.5643
## os.use1                    -11.87563  2.548235 1763  -4.660334  0.0000
## log(votes.tot2012)          -0.64038  0.355303 1763  -1.802360  0.0717
## os.use1:log(votes.tot2012)   1.92106  0.414939 1763   4.629733  0.0000
##  Correlation:
##                            (Intr) i_2015 unmp_r pct_ml age_md pct_wh
## inc_2015                   -0.051
## unemp_rate                 -0.095  0.214
## pct_male                   -0.335 -0.072  0.032
## age_med                    -0.059 -0.461 -0.121  0.002
## pct_white                  -0.351 -0.015  0.099 -0.024 -0.136
## pct_latino                 -0.148  0.089 -0.039  0.001  0.122  0.254
## pct_black                  -0.089  0.124  0.011 -0.212 -0.034  0.375
## pct_hs                     -0.806  0.084  0.006  0.004 -0.047  0.020
## tch.use1                    0.135  0.023 -0.009  0.004  0.003 -0.026
## os.use1                    -0.188 -0.045  0.042 -0.021  0.004  0.008
## log(votes.tot2012)         -0.292 -0.100  0.025  0.061  0.086  0.047
## os.use1:log(votes.tot2012)  0.174  0.035 -0.040  0.043  0.001 -0.011
##                            pct_lt pct_bl pct_hs tch.s1 os.us1 l(.201
## inc_2015
## unemp_rate
## pct_male
## age_med
## pct_white
## pct_latino
## pct_black                  -0.001
## pct_hs                      0.012  0.031
## tch.use1                    0.026 -0.046 -0.294
## os.use1                    -0.001  0.075 -0.014  0.019
## log(votes.tot2012)          0.022 -0.019 -0.009  0.012  0.768
## os.use1:log(votes.tot2012) -0.006 -0.080  0.031  0.001 -0.973 -0.833
##
## Standardized Within-Group Residuals:
##        Min         Q1        Med         Q3        Max
## -5.5307630 -0.6415712  0.0126067  0.6059159  3.7113064
##
## Number of Observations: 1846
## Number of Groups: 72
Did the recount change these findings?
In a word, no (outputs on request). The recount did not significantly change any of the outputs of the models considered in this analysis, and voting machine presence was still a significant predictor of the 2016 Democrat vote. This is not surprising, as any manipulation of the voting machines could have impacted the result before the ballots/output vote data was produced from the voting machine.
Conclusions
This analysis compared voting systems alongside a range of demographic variables. The presence of touchscreen voting machines in a voting municipality in Wisconsin in the 2016 Presidential election reduced the Democrat vote, and effect that did not exist in the 2012 election. In municipalities won by Democrats in 2012, the vote was 8% lower on average in places where touchscreen voting systems were present. The vote for Democrats dropped across the vast majority of municipalities in Wisconsin in 2016 compared to 2012; however, the presence of touchscreen voting systems was linked to an additional drop in 4.6%. The recount had no effect on these findings.
So, what can we do with this information? Well I should say that despite the strong statistical evidence provided here, correlation does not always imply causation... We need a sensible reason to explain why the presence of touchscreen voting systems caused such effects. That is something that I cannot provide. The voting machine software and hardware need be investigated to ensure - if there is any relevant data trail - that no irregularities occured during the voter input, and also that there are no security vulnerabilities to hacking.
In the current political context I very much doubt that such actions will be taken in the near future, but well, the first step in solving a problem is identifying the problem. Hopefully one day a full investigation of voting systems will take place in the US, and that people will once more have confidence in the integrity of the electoral system.


Comments !