Influence of Sequoia AVC Edge touchscreen use on the Wisconsin Trump vote
- The proportion of votes coming from use of the Sequoia AVC Edge electronic voting system in Wisconsin was significantly correlated with increases in vote % for Trump in the 2016 Republican primary and the 2016 Presidential vote. This was not the case for the 2012 Presidential contest.
- This finding held true even when the use of AVC Edge voting machines was considered alongside a range of municipality-level demographic and voting method variables.
- Results suggest that if manipulation occurred, it did not artificially increase the number of voters but instead modified the votes of genuine voters.
- An investigation of the physical voting machines used in Wisconsin in 2016 is needed to determine whether they have been tampered with before or during the 2016 elections to favour Trump.
Introduction
My previous analysis suggested that the Wisconsin 2016 vote may have been affected by the extent of the use of voting machines (also known as touchscreen voting systems, or direct recording electronic voting, DRE, machines).
This post shows that the use of Sequoia Dominion AVC Edge voting machines in Wisconsin municipalities in the 2016 Republican primary and 2016 Presidential election was strongly and positively correlated with higher votes for Trump, even when considered alongside a large number of municipality-level demographic, income, educational, and election-related variables (both for original vote data and following the recount). These findings suggest that the Sequoia voting machines used in Wisconsin in 2016 should be investigated further to determine whether any vulnerabilities of such systems (for example see here, and here, and reported voting machines with broken tamper-proof seals here) were manipulated in 2016 to influence the vote.
In the following analysis, the effect of the extent of the use of voting machines on the Presidential elections in 2012 and 2016 are compared against a number of municipality-level demographic variables, inspired by post about the 2016 election by Thomas Cooley, Ben Griffy, and Peter Rupert at Economic Snapshot and by further discussions with Professor Barry Burden of the University of Wisconsin, Madison. Demographic, income, and educational data at the municipality level was taken from the TIGER database of 2011-2015 American Community Survey (ACS) 5-year estimates. Vote and voting machine data was taken from the Wisconsin Elections Commission. Finally, the spatial data used for the maps was taken from the 'GeoData@Wisconsin' site, hosted by the University of Wisconsin - Madison.
If you want to recreate this analysis yourself, the data underlying the analysis described here can be found at Github. The .csv files used in the models are named modeldfward.o.csv (original data), and modeldfward.r.csv (recount data).
Overview of voting machine effect on the Republican vote change 2012 - 2016
See the full-size Carto map the change in Republican vote from 2012 to 2016 and influence of voting machines.
Results summary
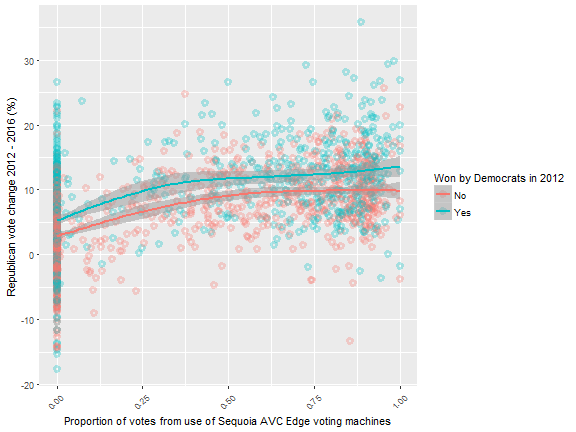
| AVC Edge machines used by > 25% of voters? | Change in Republican vote (%) |
|---|---|
| No | 4.0 |
| Yes | 10.8 |
| Won by Democrats in 2012 | AVC Edge machines used by > 25% of voters? | Change in Republican vote (%) |
|---|---|---|
| No | No | 3.0 |
| No | Yes | 9.5 |
| Yes | No | 5.4 |
| Yes | Yes | 12.4 |
The above graph and tables show a strong trend in increasing change in Republican vote in Wisconsin municipalities between 2012 and 2016 according to how often touchscreen voting machines (specifically the Sequoia AVC Edge system) were used in each location. By using statistical models called linear regression models, and looking at the Republican vote compared against touchscreen and other variables such as ethnicity, age, education, method of voting, and previous voting patterns, we can determine whether this trend is statistically significant and worth looking into further, or if it can be explained by other variables and / or random variation in votes. This analysis considered not only the influence of AVC Edge touchscreen use in Wisconsin in the 2016 Presidential election, but also in the 2012 Presidential election and the 2016 Republican primary. For the Trump spring primary, the 2016 Presidential vote, and the change in Republican vote between 2012 and 2016, the use of the Sequoia AVC Edge touchscreen voting system was a statistically significant in increasing the votes for Trump.
An important note: This correlation, despite its strength, does not indicate 100% that voting systems were intentionally manipulated. This will only be confirmed following analysis of the specific machines used in the 2016 contests, preferably in the areas where touchscreen use is most strongly correlated with the greatest increases in Republican vote compared to 2012.
The graphs, tables, and model outputs underlying this analysis are presented further down this post. However, first I will summarise the results to show all of the variables that significantly influenced the Republican vote in 2012 and 2016. In the following results summaries, variables that had a statistically significant effect on the Republican / Trump vote in 2012 and 2016 are highlighted. '+' symbols indicate that a particular variable had a positive effect on the Republican vote in the election indicated on the column header (p < 0.05). '-' symbols indicate that the variable had a negative effect. 'NA' indicates that the variable was not included in that particular model.
For the stats people - errors were clustered by county to account for correlation between variables in these spatial units, meaning that significance terms are often 'less significant' than a standard linear regression would give.
Proportion of touchscreen use 2012 to 2016
| Independent variable | Republican presidential vote 2012 | Trump spring primary 2016 | Trump vote change primary to 2016 presidential election | Republican presidential vote 2016 | Republican vote change presidential 2012 to 2016 |
|---|---|---|---|---|---|
| Proportion of AVC Edge use | + | + | + | ||
| Change in AVC Edge use 2012-2016 Presidential | NA | NA | NA | ||
| Change in AVC Edge use Republican 2016 Primary-2016 Presidential | NA | NA | - | - | - |
-
Vote for Trump in primary, Republican vote 2016, and Republican vote change 2012-2016 were POSITIVELY affected by percentage of ballots coming from use of the Sequoia AVC Edge in a municipality. This effect did not change between the primary and the final 2016 vote.
-
The increased vote for Republicans from use of the Sequoia AVC Edge was not due simply to an increased percentage of voters using the touchscreen system. In fact, compared to the Republican primary in 2016, increased touchscreen use had a negative effect. These results suggest that if manipulation occurred, it did not artificially increase the number of voters in the 2016 Presidential election, but instead modified the votes of those who had actually voted using the AVC Edge.
Other vote method variables 2012 to 2016
| Independent variable | Republican presidential vote 2012 | Trump spring primary 2016 | Trump vote change primary to 2016 presidential election | Republican presidential vote 2016 | Republican vote change presidential 2012 to 2016 |
|---|---|---|---|---|---|
| Total ballots counted | + | ||||
| Voter turnout % | - | + | |||
| Proportion voters registered same day | + | + | |||
| Proportion absentee ballots rejected | |||||
| Proportion absentee ballots counted | + | - | - |
-
Greater number of ballots counted (an indicator for the population size of the municipality) had a positive effect on the Republican vote only in 2012.
-
Votes for Trump in the 2016 Presidential contest were higher where more voters registered on the same day.
-
Trump votes in the 2016 Presidential contest were lower Where the proportion of absentee ballots were highest.
Demographic variables 2012 to 2016
| Independent variable | Republican presidential vote 2012 | Trump spring primary 2016 | Trump vote change primary to 2016 presidential election | Republican presidential vote 2016 | Republican vote change presidential 2012 to 2016 |
|---|---|---|---|---|---|
| Population density | - | - | - | - | - |
| Male % | + | + | |||
| Black % | |||||
| Latino % | |||||
| White % | + | + | + | + | |
| University graduate % | - | - | - | - | - |
| Median age | + | ||||
| Per capita income | + | - | - | - | |
| Unemployment rate | + |
-
Municipalities of lower population density consistently voted more for Republicans in 2012 and 2016
-
In 2012 poorer people voted more for Democrats. In 2016 this was reversed - in the Primary poorer people went for Trump, and in the presidential contest richer people went for Clinton, poorer for Trump.
-
Men were more likely to vote for Republicans for the 2016 Presidential contest.
-
White people were more likely to vote Republican in 2012 and for Trump in 2016. Black and Latino voters did not significantly favour Democrats or Republicans in any contests.
-
University graduates were more likely to vote Democrat in all instances.
-
Older people and unemployed people were more likely to vote for Trump in the 2016 Republican primary, but not in the 2016 presidential election.
Votes in previous elections
| Independent variable | Republican presidential vote 2012 | Trump spring primary 2016 | Trump vote change primary to 2016 presidential election | Republican presidential vote 2016 | Republican vote change presidential 2012 to 2016 |
|---|---|---|---|---|---|
| Democrat vote 2012 Presidential % | NA | + | NA | - | + |
| Other vote 2012 Presidential % | - | + | - | + | |
| Trump vote Rep. primary % | NA | NA | - | + | + |
| Other vote Rep. primary % | - | ||||
| Sanders vote Dem. Primary % | |||||
| Other vote Dem. primary % | NA | NA | + |
-
Voting for Democrats or Other candidates in 2012 indicated a greater positive change in Republican votes in the 2016 Presidential contest compared to 2012, and a greater vote for Trump in the Primary. This indicated that Trump was successful at swinging 2012 'Democrat' and 'Other' voters to him.
-
Voting Trump in the primary was (unsurprisingly) linked to higher votes in the 2016 election. Voting patterns in the Democrat primary were not significantly linked to the results of the 2016 Presidential vote.
Graphs and models of the Republican / Trump vote vs AVC Edge use 2012-2016
The following section visualises the effect of Sequoia AVC Edge presence on the Republican / Trump vote, as well as the outputs of the statistical models underlying the results already summarised.
Republican vote in 2012
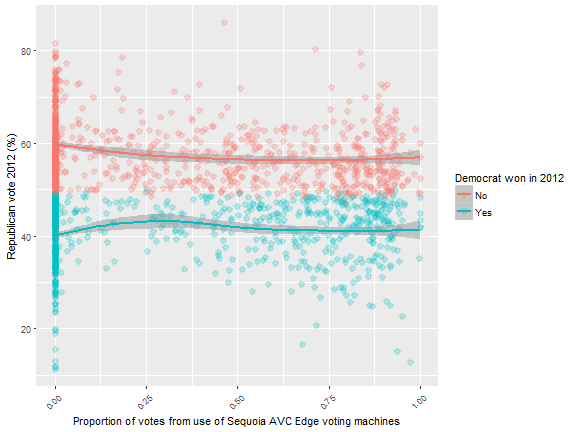
The following graph and tables show that the vote for Republicans in 2012 Presidential elections (Mitt Romney as candidate) was not significantly different in areas where Sequoia AVC Edge systems were used for at least 25% of the ballots compared to areas that used them less (49.4 vs 51.3% respectively). Below this, the model output shows that the touchscreen variable (tch_prop) did not have a statistically significant effect on the Republican vote.
| AVC Edge machines used by > 25% of voters? | Republican vote (%) |
|---|---|
| No | 51.3 |
| Yes | 49.4 |
| Won by Democrats in 2012 | AVC Edge machines used by > 25% of voters? | Republican vote (%) |
|---|---|---|
| No | No | 59.8 |
| No | Yes | 56.1 |
| Yes | No | 40.4 |
| Yes | Yes | 41.5 |
Model output
Republican 2016 election vote
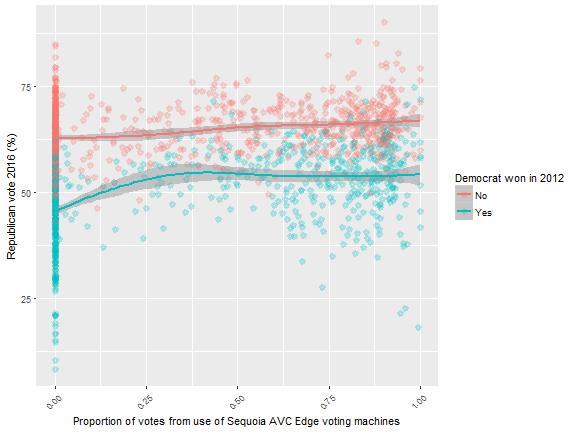
The following graph and tables show that the vote for Trump in the 2016 Presidential election was significantly different in areas where Sequoia AVC Edge systems were used compared to areas that used them less or not at all. In areas where Sequoia AVC Edge systems were used more than 25% of the time, the Trump vote was 60.4% on average compared to 55.3% in areas where they were used less or not at all. Below this, the model output shows the significant effect of the touchscreen variable (tch_prop) alongside all the other demographic and voting method variables.
| AVC Edge machines used by > 25% of voters? | Republican vote (%) |
|---|---|
| No | 55.3 |
| Yes | 60.4 |
| Won by Democrats in 2012 | AVC Edge machines used by > 25% of voters? | Republican vote (%) |
|---|---|---|
| No | No | 62.8 |
| No | Yes | 65.8 |
| Yes | No | 45.7 |
| Yes | Yes | 53.9 |
Model output
Change in Republican vote between the 2012 and 2016 Presidential election
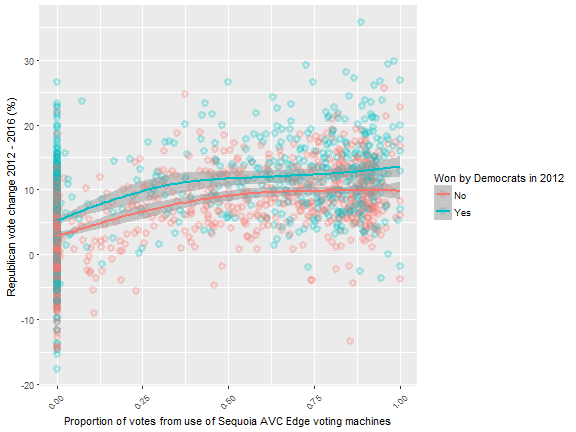
The following graph and tables show that the change in votes for Republicans between the 2012 and 2016 Presidential elections was on average + 6.8% in areas where Sequoia AVC Edge systems were used for at least 25% of the ballots, compared to areas that used them less. Below this, the model output shows the significant effect of the touchscreen variable (tch_prop) alongside all the other demographic and voting method variables.
| AVC Edge machines used by > 25% of voters? | Change in Republican vote (%) |
|---|---|
| No | 4.0 |
| Yes | 10.8 |
| Won by Democrats in 2012 | AVC Edge machines used by > 25% of voters? | Change in Republican vote (%) |
|---|---|---|
| No | No | 3.0 |
| No | Yes | 9.5 |
| Yes | No | 5.4 |
| Yes | Yes | 12.4 |
Model output
The Trump primary vote
The following graph and tables show that the vote for Trump in the 2016 Republican primary was significantly different in areas where Sequoia AVC Edge systems were used compared to areas that used them less or not at all. In areas where Sequoia AVC Edge systems were used more than 25% of the time, the Trump vote was 48.2% on average compared to 40.1% in areas where they were used less or not at all. Below this, the model output shows the significant effect of the touchscreen variable (tch_prop) alongside all the other demographic and voting method variables.
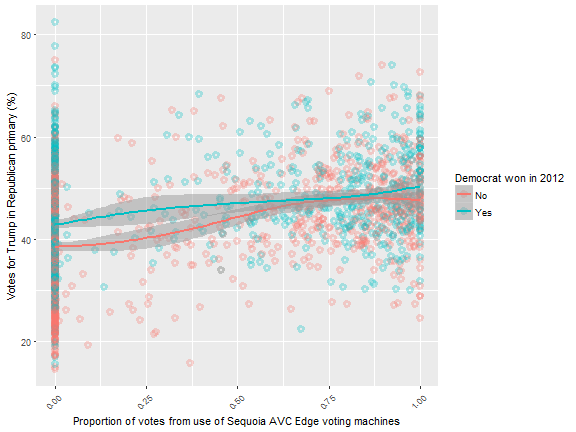
| AVC Edge machines used by > 25% of voters? | Votes for Trump in Republican primary (%) |
|---|---|
| No | 40.1 |
| Yes | 48.2 |
| Won by Democrats in 2012 | AVC Edge machines used by > 25% of voters? | Votes for Trump in Republican primary (%) |
|---|---|---|
| No | No | 38.1 |
| No | Yes | 47.6 |
| Yes | No | 42.6 |
| Yes | Yes | 48.9 |
Model output
Change in vote between primary and 2016 Presidential election
The following graph and tables show that the change in vote for Trump in the primary compared to the 2016 presidential election was not significantly different in areas where Sequoia AVC Edge systems were used for at least 25% of the ballots compared to areas that used them less (12.3% vs 15.3% respectively). Below this, the model output shows that the touchscreen variable (tch_prop) did not have a statistically significant effect on the Republican vote.
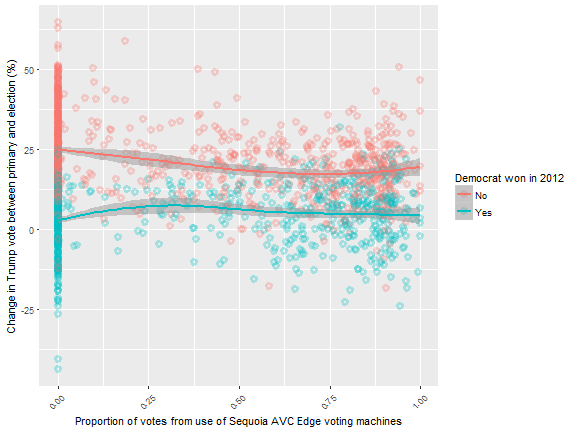
| AVC Edge machines used by > 25% of voters? | Change in Trump vote (%) |
|---|---|
| No | 15.3 |
| Yes | 12.3 |
| Won by Democrats in 2012 | AVC Edge machines used by > 25% of voters? | Change in Trump vote (%) |
|---|---|---|
| No | No | 24.8 |
| No | Yes | 18.1 |
| Yes | No | 3.1 |
| Yes | Yes | 5.1 |
Model output
Correlation issues - income, graduates, and population density
It has been pointed out to me that since the use of the AVC Edge touchscreen is somewhat correlated with income and education level that in fact the observed touchscreen effect is in fact just the combined effect of these two variables. Indeed, we can see below this negative correlation (i.e. those areas with higher income or higher proportion of university graduates were less likely to vote for Trump).
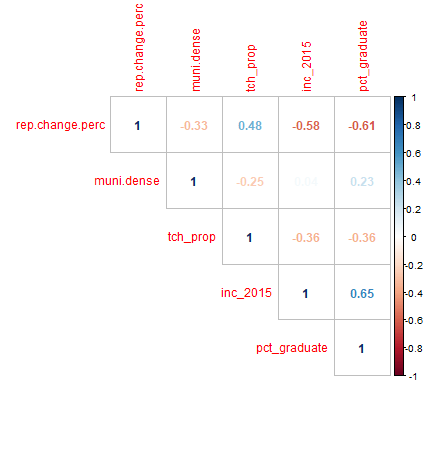
However, the linear regression models that I have featured in this post are designed to take in to account moderately correlating variables such as these and estimate their influence on the vote at the same time. So, variables (e.g. touchscreen use) that come out of the model as significant following inclusion in linear regression models should have a statistically significant effect despite the presence of correlation.
The effect of touchscreen use at varying income and percentage graduate levels can be seen in the graphs and tables below. What we can see is that in both high and low income / university graduate / population density areas, the use of the Dominion AVC Edge systems seems to increase positively increase the change in Republican vote 2012 - 20216.
Per capita income
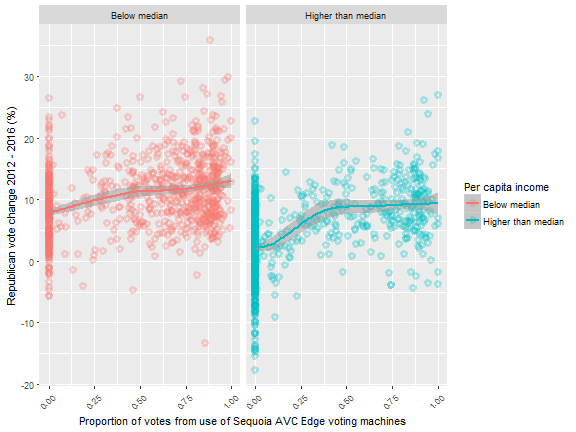
| Per capita income 2011-2015 | AVC Edge machines used by > 25% of voters? | Change in Republican vote (%) |
|---|---|---|
| Below median | No | 7.9 |
| Below median | Yes | 11.8 |
| Higher than median | No | 2.3 |
| Higher than median | Yes | 8.8 |
Percentage of university graduates
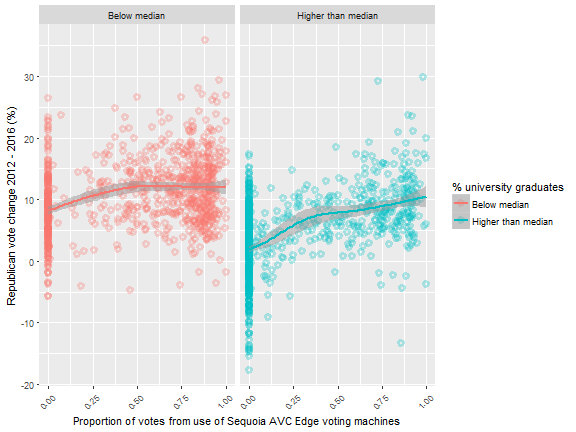
| % university graduates | AVC Edge machines used by > 25% of voters? | Change in Republican vote (%) |
|---|---|---|
| Below median | No | 8.3 |
| Below median | Yes | 12.0 |
| Higher than median | No | 2.1 |
| Higher than median | Yes | 8.7 |
Municipality population density (people / km2)
What is particularly striking about the change in Republican vote 2012-2016 in areas of different population density is that the effect of AVC Edge touchscreen appears to be stronger in areas of high density (i.e. towns / cities, with a population density of 200 people / km or greater). Were we to follow the hypothesis that the voting machines were directly manipulated - this makes sense - as hackers would likely target the areas where they get the most 'bang for their buck', namely densely-populated areas. I have not considered this finding further in this post, but any investigation should take into account that checking AVC Edge systems in densely-populated areas should be a priority.
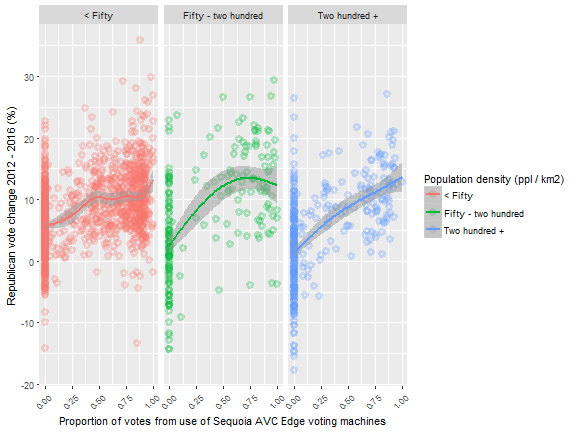
| Population density (ppl / km2) | AVC Edge machines used by > 25% of voters? | Change in Republican vote (%) |
|---|---|---|
| < Fifty | No | 5.7 |
| < Fifty | Yes | 10.5 |
| Fifty - two hundred | No | 2.8 |
| Fifty - two hundred | Yes | 13.0 |
| Two hundred + | No | 1.5 |
| Two hundred + | Yes | 10.9 |
Conclusions
In Wisconsin, votes for Trump in the 2016 Primary, and votes for Trump in the 2016 Presidential vote were significantly correlated with the proportion of voters using the Sequoia AVC Edge touchscreen system, a finding that held true even when considered alongside a multitude of demographic variables. The same touchscreen systems did not have the same effect in the 2012 Presidential election.
The results suggest that if manipulation occurred, it was not by artificially increasing the number of people who voted for Trump via the AVC Edge systems (i.e. adding 'fake' voters), but instead by modifying the votes of genuine voters.
These findings do not indicate with certainty that voting machines were manipulated in Wisconsin in 2016. They only indicate that further investigation is necessary, which requires analysing the specific AVC Edge voting machines used in Wisconsin in 2016 in the areas with the greatest increase in Republican vote from 2012. Only then can we know if security vulnerabilities were exploited to help Trump win in Wisconsin.
Comments !