Republican vote 2016 with voting machines at reporting unit level
- The use of voting machines in Wisconsin is statistically significant in increasing the vote % for Trump at the reporting unit level.
- The size of the effect suggests that voting machine use could explain up to a 13,000 vote swing to Trump (he won Wisconsin by approximately 23,000 votes).
P.S. Interactive online Carto maps of the vote in 2016 and the change in vote from 2012 to 2016 accompany these posts (municipality level). Go play with the data! Also, the code underlying the analysis described here can be found at Github. The .csv file used in the models on this page are named modeldfward.repunit.r.csv (original data).
Introduction
A previous analysis suggested that the Wisconsin 2016 vote may have been affected by the extent of the use of the AVC Edge voting machine (also known as touchscreen voting systems, or direct recording electronic voting machine). However, this analysis was conducted at the municipality level. In this short post, I will show that these results hold also at the reporting unit level. This analysis uses the data from the recount. This analysis here includes not only the AVC Edge (used in 45 of Wisconsin's 72 counties), but also the other brands of voting machines used at a much lesser extent (the Accuvote TSX, municipalities in 13 counties, and the ES&S iVotronic, 2 counties)
A note of caution: the outputs described here suggest that the use of voting machines could be a PREDICTOR of an increased or decreased vote for Republican as determined by the statistical model. We cannot know from this alone if the voting machine were manipulated in any way, it only suggests that further investigation is necessary to determine the cause of this effect.
In the following analysis, the effect of the use of voting machines on the Presidential election in 2016 are compared against a number of county-level demographic variables, many provided by a very useful post about the 2016 election by Thomas Cooley, Ben Griffy, and Peter Rupert at Economic Snapshot, and some from David Greenwald (@davidegreenwald) and colleagues, who have also been looking into the 2016 Wisconsin presidential election. Voting machine presence and make data at the municipality level was taken from Verified Voting. The spatial data used for the maps was taken from the 'GeoData@Wisconsin' site, hosted by the University of Wisconsin - Madison. Finally, the vote and registered voter data was taken from the Wisconsin Elections Commission.
One final note - to remove potentially influential outliers I removed reporting units with less than 20 votes cast, with a turnout lower than 25%, and where the vote % for Republicans reduced by 40% or more compared to 2012.
Proportion of touchscreens used in reporting units with voting machine vs none
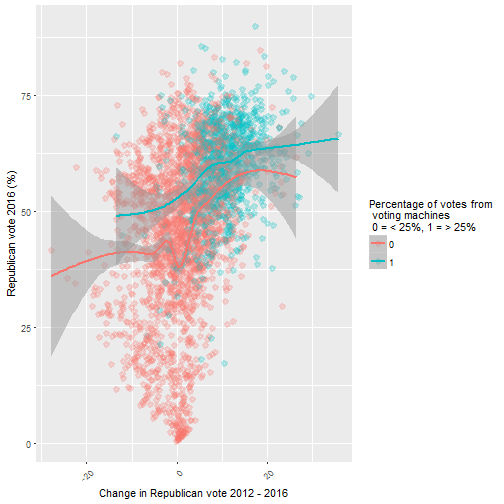
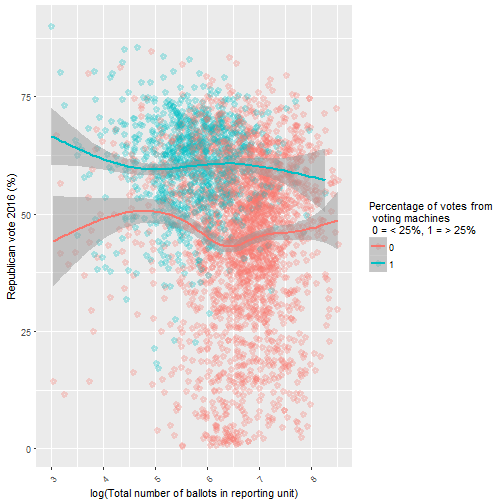
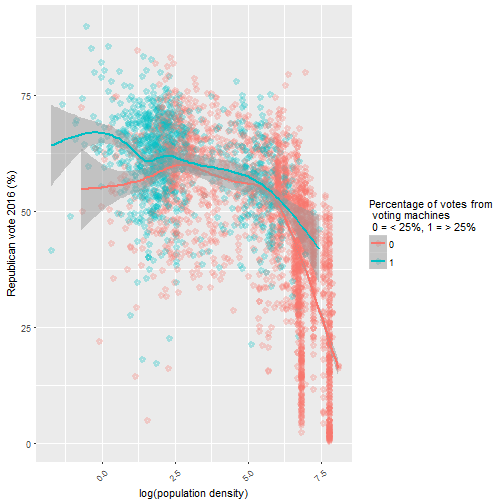
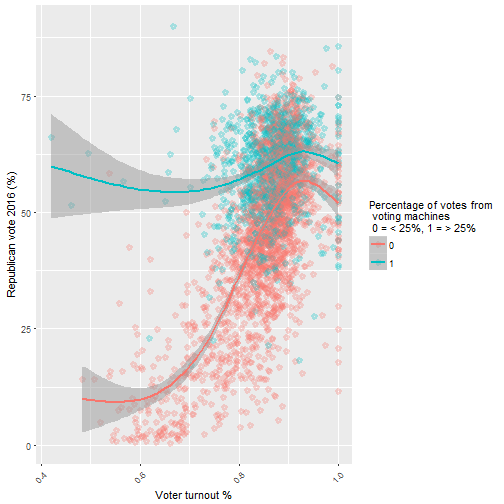
First, some graphs to show the vote for Trump in 2016 against the change in Republican vote 2012-2016, reporting unit size, population density, and voter turnout.


| voting machine used by over 25% of people? | Republican vote (%) |
|---|---|
| 0 | 45.4 |
| 1 | 60.2 |
Republican 2016 vote
## Frequencies of Missing Values Due to Each Variable
##      republican_votes.perc                   tch_prop
##                          0                          0
##              total_ballots                 muni.dense
##                          0                          8
##                   pct_male                   inc_2015
##                          4                          5
##                 unemp_rate               rep.perc2012
##                          4                          0
##               oth.perc2012    votes_perc_trump_reprim
##                          0                        259
## votes_perc_clinton_demprim                    age_med
##                        259                          4
##                  pct_white           turnout_reg_2016
##                          4                          0
##           sameday_reg_prop                 paper_prop
##                         10                          0
##               pct_graduate        counted_absent_prop
##                          4                        109
##            absentee_failed           late_registrants
##                        137                          1
##             inspector_prop       absentee_person_prop
##                          0                        137
##         registrants_change
##                          7
##
## Linear Regression Model
##
##  ols(formula = log.formula, data = model.r.df, x = TRUE, y = TRUE)
##
##
##                                  Model Likelihood     Discrimination
##                                     Ratio Test           Indexes
##  Obs                   2697     LR chi2    8033.87    R2       0.949
##  sigma               3.8827     d.f.            22    R2 adj   0.949
##  d.f.                  2674     Pr(> chi2)  0.0000    g       18.325
##  Cluster onmodel.r.df$county
##  Clusters                71
##
##  Residuals
##
##        Min        1Q    Median        3Q       Max
##  -28.16124  -2.26957  -0.00466   2.20520  21.34490
##
##
##                             Coef    S.E.   t     Pr(>|t|)
##  Intercept                  -1.9810 3.4032 -0.58 0.5606
##  tch_prop                    2.1669 0.5380  4.03 <0.0001
##  total_ballots              -0.0002 0.0003 -0.79 0.4311
##  muni.dense                 -0.0022 0.0004 -5.07 <0.0001
##  pct_male                    0.0524 0.0368  1.43 0.1541
##  inc_2015                   -0.0001 0.0000 -1.92 0.0545
##  unemp_rate                  0.0540 0.0695  0.78 0.4373
##  rep.perc2012                0.8592 0.0191 44.97 <0.0001
##  oth.perc2012                0.2112 0.1665  1.27 0.2046
##  votes_perc_trump_reprim     0.1662 0.0194  8.59 <0.0001
##  votes_perc_clinton_demprim  0.0282 0.0112  2.51 0.0123
##  age_med                     0.0620 0.0248  2.49 0.0127
##  pct_white                   0.0973 0.0156  6.23 <0.0001
##  turnout_reg_2016           -0.4181 2.1817 -0.19 0.8481
##  sameday_reg_prop           -0.4153 2.0051 -0.21 0.8359
##  paper_prop                  0.2597 0.4323  0.60 0.5481
##  pct_graduate               -0.2218 0.0287 -7.73 <0.0001
##  counted_absent_prop        -9.6595 1.4090 -6.86 <0.0001
##  absentee_failed            -2.1093 1.6669 -1.27 0.2058
##  late_registrants           -1.1186 9.1708 -0.12 0.9029
##  inspector_prop             -5.0499 6.0680 -0.83 0.4054
##  absentee_person_prop        0.5897 0.4747  1.24 0.2142
##  registrants_change         -3.3671 1.1945 -2.82 0.0049
##
The below model compares the factors that may have affected the votes for Trump in 2016. The 'use of voting machine' factors is called 'tch_prop' (at the top), and represents the proportion of votes conducted by voting machine in the reporting unit. The other factors in the model cover a number of election-related and demographic variables. The model is a robust linear regression with errors clustered around county. Email or tweet me if you want full details.
In summary, the model shows that going from 0 to 100% use of the voting machine touchscreen technology in a Wisconsin reporting unit had the effect of increasing the vote for Trump in 2016 by 2.17%. This finding is statistically significant (Pr(>|t|) lower than 0.05). Considering the number of votes conducted using voting machine technology in in Wisconsin 2016 (299,503), this would be equivalent to approximately 6,500 votes potentially being flipped, i.e. giving ~ 13,000 votes to Trump. Trump won the state by 22,748 votes (post recount).
These findings do not prove conclusively that any voting machine in Wisconsin in 2016 were hacked or manipulated, they just suggest that further investigation of the machines and the election management systems is needed to confirm either way.
Comments !